This article explains, how to enable trace for Concurrent Program and generate TKPROF in Oracle Apps. These steps should work for Oracle Apps 11i and R12 release.
Concurrent programs execute business logic by connecting to the database and performing database operations like updating, inserting, and deleting. These operations consume CPU, Memory, and other resources. An ill-written concurrent program may impact your overall ERP instance and slow it down during business hours.
You can trace the concurrent program and generate tkprof to understand how queries are running, whether is there any full table scan, or any query that needs tuning.
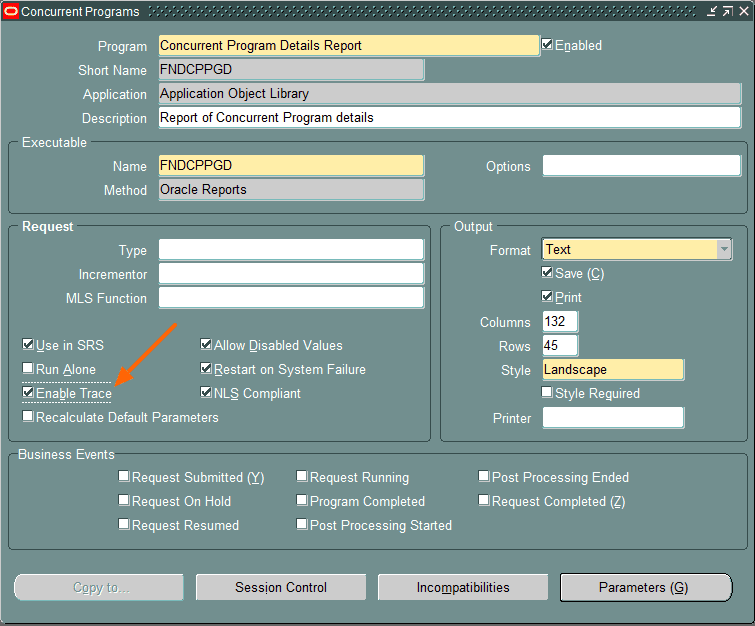
1. Enable trace for Concurrent Programs
Log in to Oracle App and navigate to Application Developer-> Concurrent Program –> Define. Query the concurrent program (Use F11 and Ctrl + F11). Check the Enable Trace checkbox as shown below and save.
2. Run Concurrent Program
Now, go to the responsibility where the concurrent program is registered. Navigate to View -> Request -> Submit Request and submit the concurrent program. Wait till the concurrent program is completed before moving to the next steps.
3. Find Trace file path
Use the below query to get the trace file location. This is the actual physical directory on the database server. The trace file is generated at the database tier.
SELECT value
 FROM v$parameter
 WHERE name='user_dump_dest';
4. Name of the trace file
The trace file name follows some naming standards. It contains oracle_process_id generated internally. Let’s see how to find out the name. Assume that the request ID is 35133016.
Use the below query to get the Oracle Process ID.
SELECT oracle_process_id
 FROM fnd_concurrent_Requests
WHERE request_id = 35133016;
It is 121313 for the request-id 35133016.
Now login to the Unix/Linux database server. Navigate to the path that you got in the previous step and run the below Unix ls command.
ls *121313*
-rwxrwxrwx. 1 nobody ora_dba 180K Mar 13 02:24 TSTINSTANCE_ora_121313_APPS_0313_020936.trc
The trace file name is TSTINSTANCE_ora_121313_APPS_0313_020936.trc.
5. Format Trace file using TKPROF
The generated trace file(.trc) file contains all the information and it is not human readable. You need to use the tkprof command utility to convert to a readable format.
Sample trace file
=====================
PARSING IN CURSOR #139949424689864 len=33 dep=0 uid=173 oct=47 lid=173 tim=2369959266663 hv=1991901736 ad='8c58fed08' sqlid='4g2612tvbn0j8'
begin FND_TRACE.START_TRACE; end;
END OF STMT
EXEC #139949424689864:c=8997,e=10037,p=0,cr=0,cu=0,mis=0,r=1,dep=0,og=1,plh=0,tim=2369959266661
WAIT #139949424689864: nam='SQL*Net message to client' ela= 2 driver id=1952673792 #bytes=1 p3=0 obj#=34388 tim=2369959266722
WAIT #139949424689864: nam='SQL*Net message from client' ela= 260 driver id=1952673792 #bytes=1 p3=0 obj#=34388 tim=2369959266999
CLOSE #139949424689864:c=0,e=12,dep=0,type=1,tim=2369959267035
WAIT #139949424692008: nam='SQL*Net message to client' ela= 0 driver id=1952673792 #bytes=1 p3=0 obj#=34388 tim=2369959267136
=====================
Run below command to generate TKPROF on the Unix tier.
tkprof TSTINSTANCE_ora_121313_APPS_0313_020936.trc trace.txt apps/<apps username>
Below is generated TKPROF file
TKPROF: Release 12.1.0.2.0 - Development on Tue Mar 13 02:23:39 2018

Copyright (c) 1982, 2014, Oracle and/or its affiliates.  All rights reserved.

Trace file: TSTINSTANCE_ora_108549_APPS_0313_020936.trc
Sort options: prsela  exeela  fchela
********************************************************************************
count    = number of times OCI procedure was executed
cpu      = cpu time in seconds executing
elapsed  = elapsed time in seconds executing
disk     = number of physical reads of buffers from disk
query    = number of buffers gotten for consistent read
current  = number of buffers gotten in current mode (usually for update)
rows     = number of rows processed by the fetch or execute call
********************************************************************************

SELECT    f.column_seq_num                          Sequence,
          f.form_left_prompt                        Prompt,
          f.end_user_column_name                    Name,
          f.description                             Description,
          decode(f.enabled_flag,'Y','Yes','No')     ParamEnabled ,
          decode(f.display_flag,'Y','Yes','No')     ParamDisplayed ,
          f.srw_param                               Token,
          fv.flex_value_set_name                    ValueSet,
          f.default_value                           DefaultValue,
          substr(descriptive_flexfield_name,7)   ParamConcProg
FROM      fnd_descr_flex_col_usage_vl  f ,
          fnd_flex_value_sets              fv
  WHERE ( f.flex_value_set_id = fv.flex_value_set_id ) AND ( :ConcProgName = substr(descriptive_flexfield_name,7))  order by f.column_seq_num

call     count       cpu    elapsed       disk      query    current        rows
------- ------  -------- ---------- ---------- ---------- ----------  ----------
Parse        0      0.00       0.00          0          0          0           0
Execute      1      0.00       0.00          0          0          0           0
Fetch        1      0.70       2.91      10977      11951          0           1
------- ------  -------- ---------- ---------- ---------- ----------  ----------
total        2      0.70       2.91      10977      11951          0           1

Misses in library cache during parse: 0
Optimizer mode: ALL_ROWS
Parsing user id: 173  (APPS)

Rows     Execution Plan
-------  ---------------------------------------------------
      0  SELECT STATEMENT   MODE: ALL_ROWS
      0   SORT (ORDER BY)
      0    HASH JOIN
      0     HASH JOIN
      0      TABLE ACCESS   MODE: ANALYZED (FULL) OF
                 'FND_DESCR_FLEX_COLUMN_USAGES' (TABLE)
      0      TABLE ACCESS   MODE: ANALYZED (FULL) OF
                 'FND_FLEX_VALUE_SETS' (TABLE)
      0     TABLE ACCESS   MODE: ANALYZED (FULL) OF
                'FND_DESCR_FLEX_COL_USAGE_TL' (TABLE)


Elapsed times include waiting on following events:
  Event waited on                             Times   Max. Wait  Total Waited
  ----------------------------------------   Waited  ----------  ------------
  Disk file operations I/O                        5        0.00          0.00
  db file scattered read                        754        0.01          2.23
  db file sequential read                        15        0.00          0.02
  SQL*Net message to client                       1        0.00          0.00
  SQL*Net message from client                     1        0.00          0.00
********************************************************************************
Summary
Generating trace and tkprof of concurrent programs helps you to pinpoint the exact SQL that is causing the program to run slowly.
I hope you found this helpful. Please share and subscribe.