Oracle Apps uses OAF as one of the Technology to create a user interface. OAF is basically an HTML page that uses JavaScript and Java to process transactions. These transactions involves querying database, running SQL and PL/SQL packages from the OAF page.
As OAF is used to design a user interface, a slow page frustrates the end-user.
There is direct interaction between user and page unlike concurrent program which runs in background. So it is always good to fine-tune the page to make sure it is fast and efficient.
We have already covered how to enable trace for Oracle Forms, Reports, and concurrent programs.
Here, let’s see how to enable trace for OAF pages.
Enable trace for OAF page
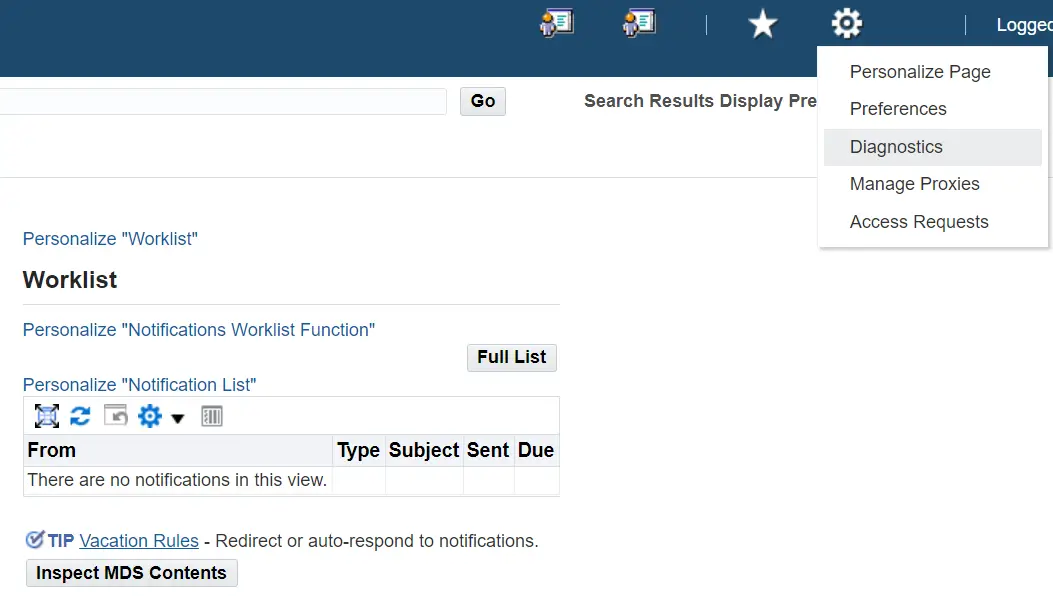
1. Log in to Oracle Apps with username and password. Click on the gear icon on the left-hand side and select Diagnostics option.
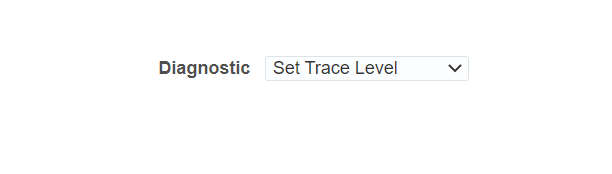
2. This open a page as shown below. Select Set Trace Level option from lov and click the Go button.
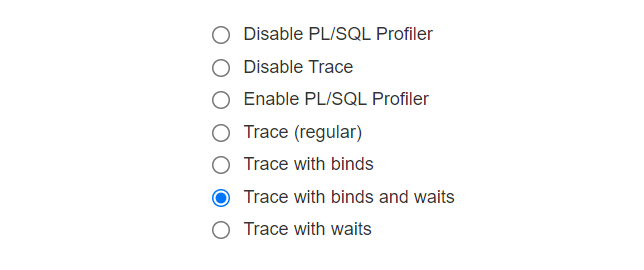
3. Next is the Set Trace Content page where you will find multiple options. Select Trace with binds and wait. You can choose other option as per your requirement.
Click the Go button.
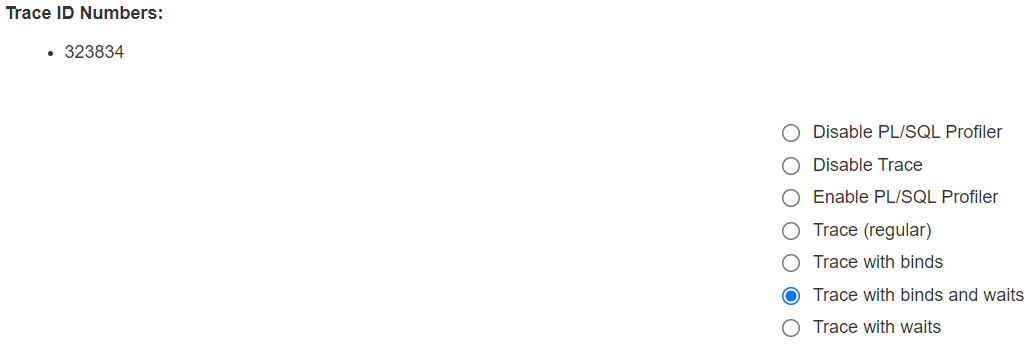
4. Note down the Trace ID Number. Click the Save button. The trace file name contains this Trace id.
5. Now, open the respective OAF page and do a transaction which you want to trace. When the transaction completes just go ahead and disable the trace. Go to Diagnostics menu again and choose Disable Trace option. This stops the trace file generation.
6. Oracle stores the trace file on Linux Application Server. Query v$parameter view to find out the trace file location.
SELECT value
 FROM v$parameter
 WHERE name='user_dump_dest';
7. Login to Unix or Linux application Tier and navigate to the path given by the above query.
cd <path-from-above-query>
Replace <path-from-above-query> by the actual trace file path you got from step number 3.
8. Now, let’s find the trace file.
ls *323834*
Here, 323834 is the trace file identifier which you got from step 1
9. Next, Run tkprof command as shown below.
tkprof 323834.trc 323834.txt explain=apps/<apps password> sys=no sort=prsela,exeela,fchela
This generates a file with name 323834.txt.
Summary
We covered the method to generate trace and tkprof for the OAF form. Go ahead and use it to find the problematic query causing performance issues and tune it.
The above method should work for both Oracle apps 11 and R12 version.
I hope you liked this article. Please share and subscribe.